leaflet是一个开源的前端地图交互类库,比较轻量级,支持移动端。而且有丰富的插件资源可供我们使用。
Echarts是百度开源的前端可视化类库,提供丰富的前端可视化图表,平台中重要的一部分是我们要将leaflet和Echarts结合在一起。
该平台是基于leaflet及其插件搭建的一个方便可用的可视化平台。详细参见[示例Demo]。(https://zrysmt.github.io/demo/leaflet-demo/)
1. 安装与编译
- 安装
1 | npm install |
- 编译
debug模式
1 | npm run dev |
输出
1 | npm run build |
2.示例简介
示例地址:https://zrysmt.github.io/demo/leaflet-demo/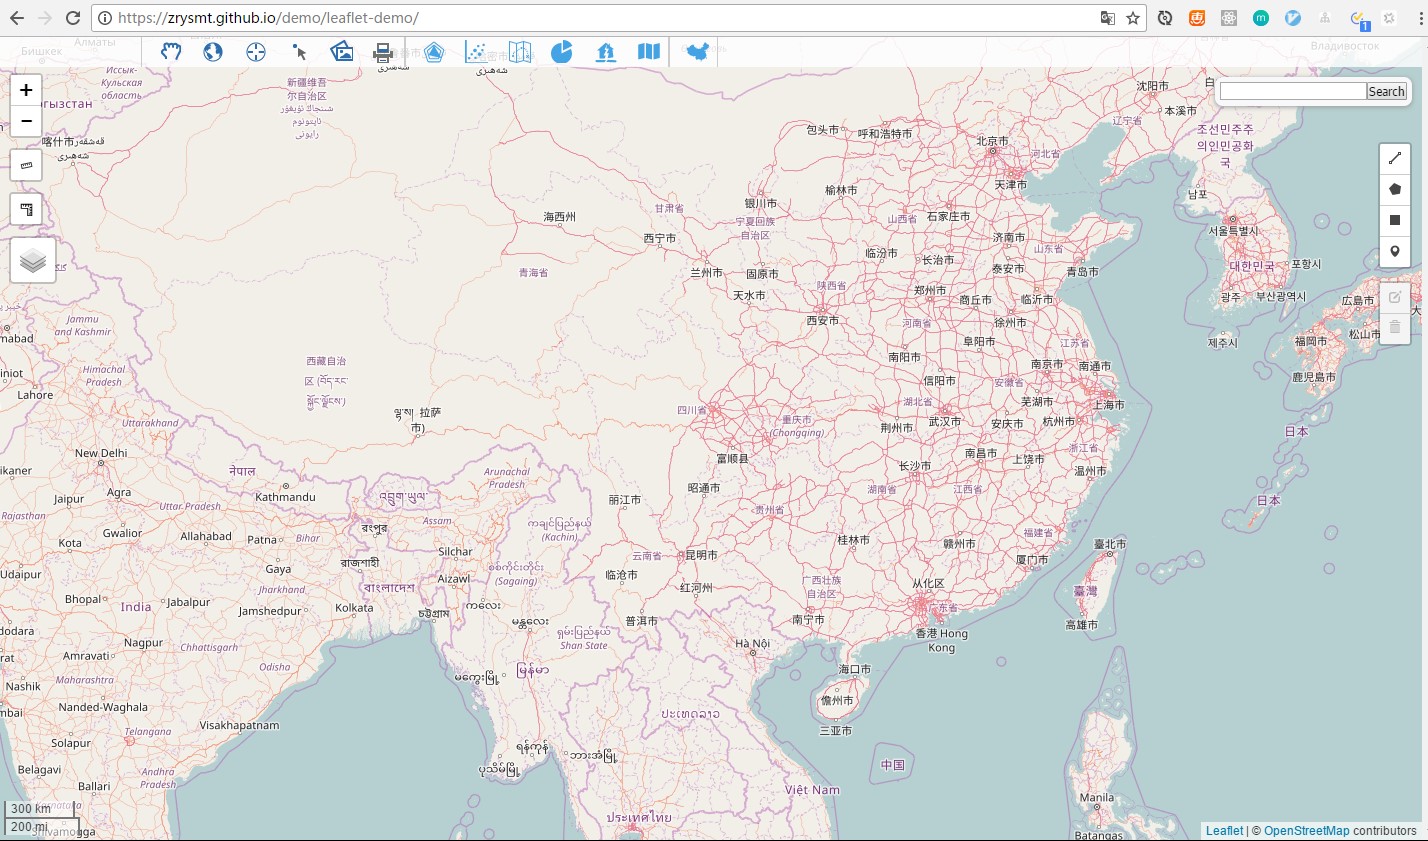
示例包含最基本的GIS功能和可视化Demo
3.基础的GIS功能
- 拖放、全图、定位、打印出图片、打印出PDF功能。

- 地图缩放、比例尺显示功能
- 测量面积和距离功能
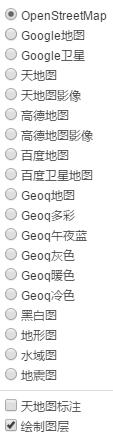
- 图层切换,提供丰富的图层切换
- 地图搜索功能
- 基础绘图功能

4.可视化示例

- 热力图
引入:1
import '../common/leaflet-plugin/HeatLayer.js';
使用:1
2
3
4
5var heat = L.heatLayer([
[50.5, 30.5, 0.2], // lat, lng, intensity
[50.6, 30.4, 0.5],
...
], {radius: 25}).addTo(map)
效果图: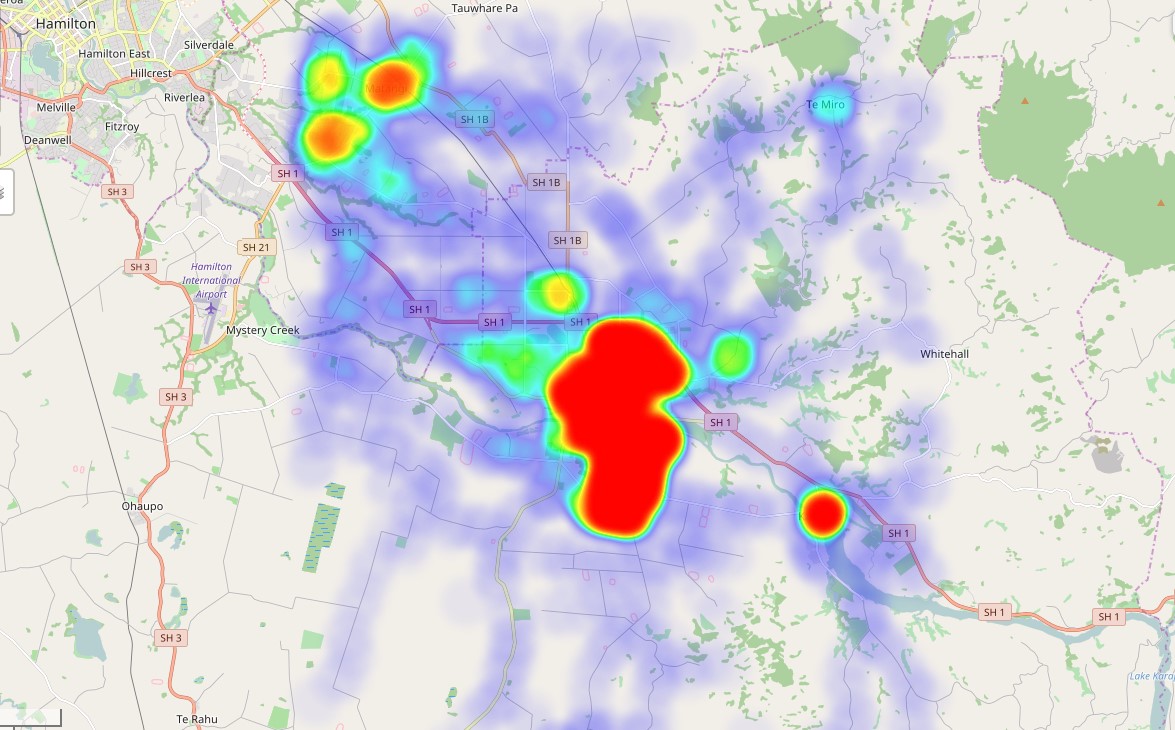
- 结合Echarts
1 | let overlay = new L.echartsLayer3(map, echarts); |
迁徙图(选择了高德卫星底图)
散点图(选择了Geoq午夜蓝底图)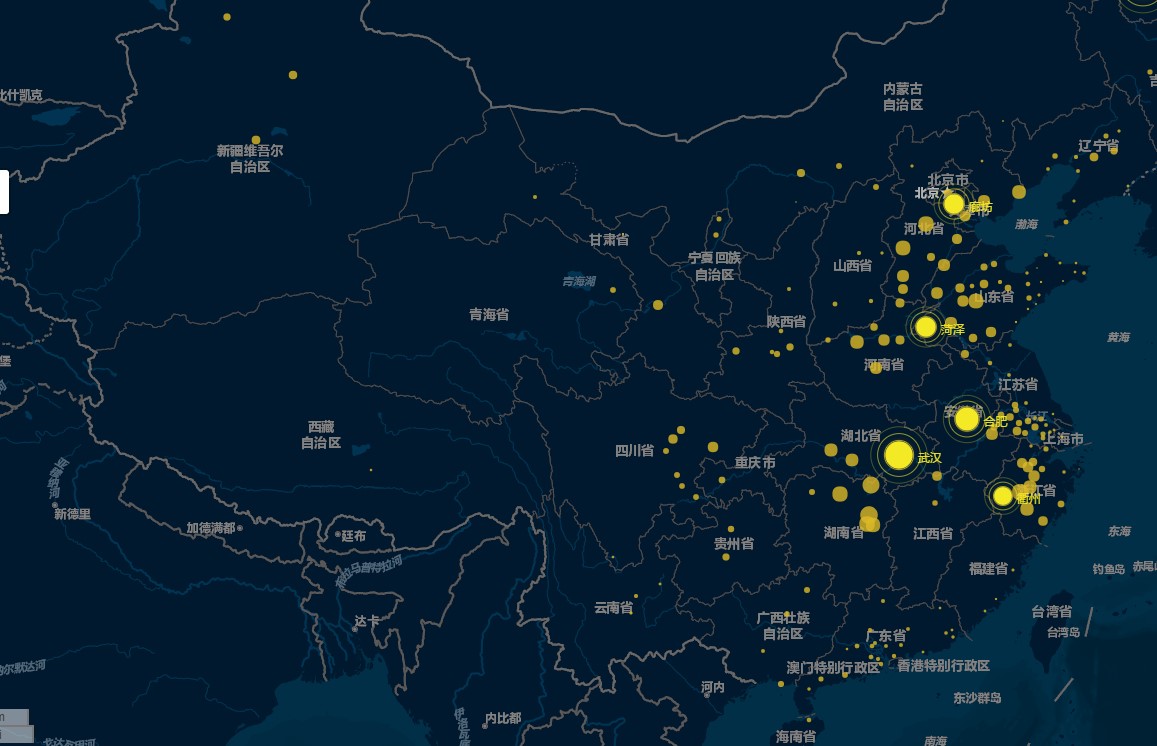
- DivIcon结合Echarts
这个方案不太适合大数据量的渲染。
我写了两个简单的功能函数,一个用来渲染可视化图(echartsIcon),一个专门用来渲染图例(echartsLegend)。
效果图(底图选择了为google底图)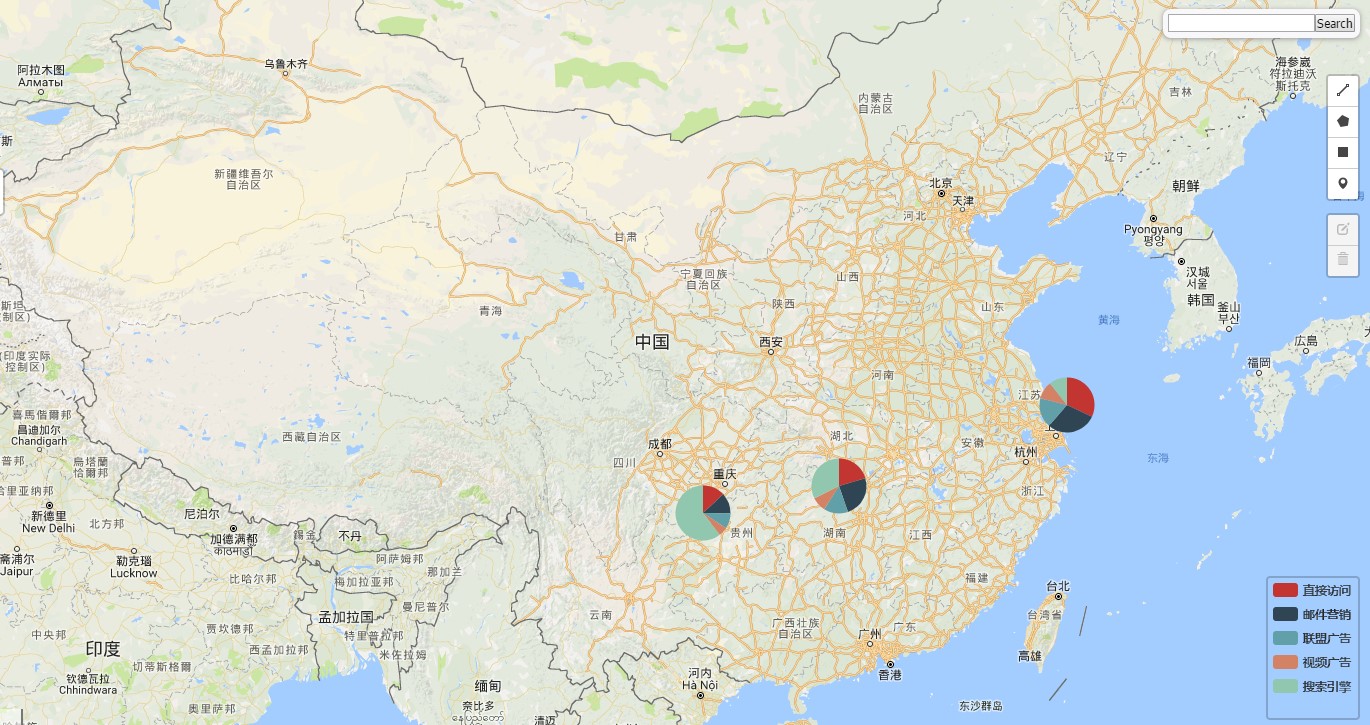
1
2
import echartsIcon from '../common/plugin/echartsIcon.js'; //echartsLegend
import echartsLegend from '../common/plugin/echartsLegend.js'; //echartsLegend
1 | let option = { |
- leaflet-dvf
leaflet-dvf是一个基于leaflet的数据可视化框架,提供有比较多的可视化图形。1
2import "../common/leaflet-plugin/Leaflet.dvf/css/dvf.css";
import "leaflet-dvf";
地震图: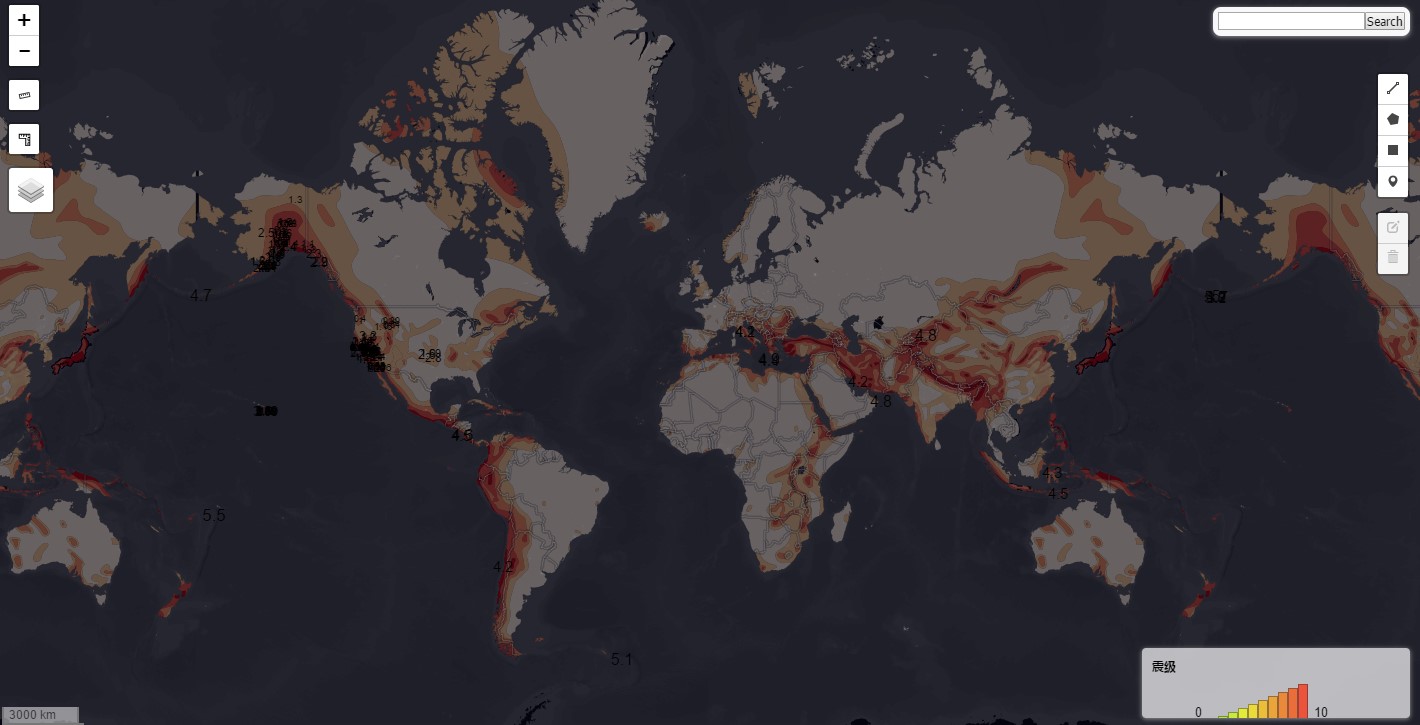
收入水平图: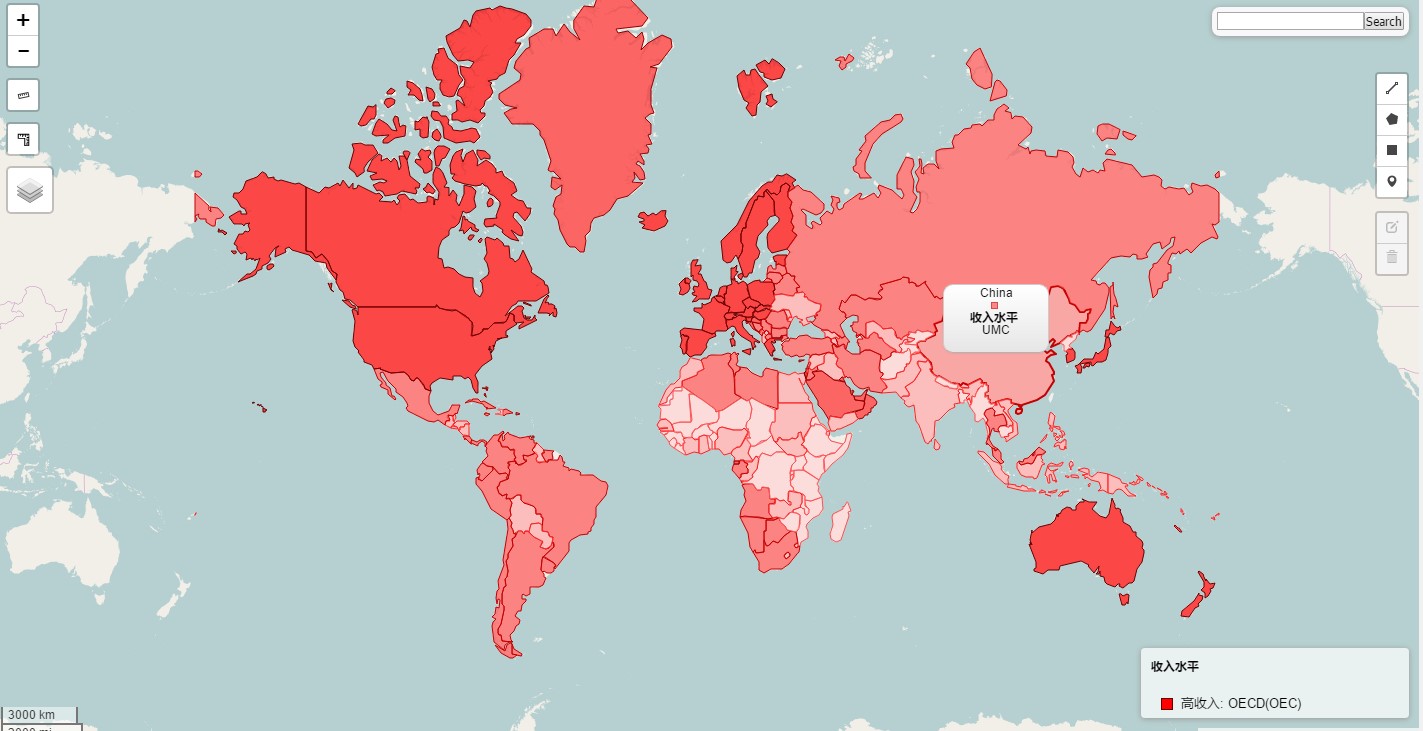
需要的数据1
2import earthquakesData from '../data/earthquakes.json';
import countryData from '../data/countryData.js';
地震图代码:1
2
3
4
5
6
7
8
9
10
11
12
13
14
15
16
17
18
19
20
21
22
23
24
25
26
27
28
29
30
31
32
33
34
35
36
37
38
39
40
41
42
43
44
45
46
47
48
49
50
51
52
53
54
55
56
57
58
59
60
61
62
63
64
65
66
67
68
69
70
71
72
73
74
75
76
77
78
79
80
81
82
83
84
85
86
87
88let lastLayer;
let eqfeed_callback = function(data) {
// Initialize framework linear functions for mapping earthquake data properties to Leaflet style properties
// Color scale - green to red using the basic HSLHueFunction
let magnitudeColorFunction = new L.HSLHueFunction(new L.Point(0, 90), new L.Point(10, 0), { outputSaturation: '100%', outputLuminosity: '25%', postProcess: null });
let magnitudeFillColorFunction = new L.HSLHueFunction(new L.Point(0, 90), new L.Point(10, 0), { outputSaturation: '100%', outputLuminosity: '50%', postProcess: null });
let magnitudeRadiusFunction = new L.LinearFunction(new L.Point(0, 10), new L.Point(10, 30), { postProcess: null });
let now = Math.round((new Date()).getTime());
let start = now - 86400000;
// Initialize a linear function to map earthquake time to opacity
let timeOpacityFunction = new L.LinearFunction(new L.Point(start, 0.3), new L.Point(now, 1));
let fontSizeFunction = new L.LinearFunction(new L.Point(0, 8), new L.Point(10, 24));
let textFunction = function(value) {
return {
text: value,
style: {
'font-size': fontSizeFunction.evaluate(value)
}
};
};
// Setup a new data layer
let dataLayer = new L.DataLayer(data, {
recordsField: 'features',
latitudeField: 'geometry.coordinates.1',
longitudeField: 'geometry.coordinates.0',
locationMode: L.LocationModes.LATLNG,
displayOptions: {
'properties.mag': {
displayName: '震级',
color: magnitudeColorFunction,
fillColor: magnitudeFillColorFunction,
radius: magnitudeRadiusFunction,
text: textFunction
},
'properties.time': {
displayName: '时间',
opacity: timeOpacityFunction,
fillOpacity: timeOpacityFunction,
displayText: function(value) {
return moment.unix(value / 1000).format('MM/DD/YY HH:mm');
}
}
},
layerOptions: {
numberOfSides: 4,
radius: 10,
weight: 1,
color: '#000',
opacity: 0.2,
stroke: true,
fillOpacity: 0.7,
dropShadow: true,
gradient: true
},
tooltipOptions: {
iconSize: new L.Point(90, 90), //hover框大小
iconAnchor: new L.Point(-4, 76)
},
onEachRecord: function(layer, record, location) {
let $html = $(L.HTMLUtils.buildTable(record));
layer.bindPopup($html.wrap('<div/>').parent().html(), {
minWidth: 400,
maxWidth: 400
});
}
});
// Add the data layer to the map
map.addLayer(dataLayer);
lastLayer = dataLayer;
};
this.mapSetting();
if (lastLayer) {
map.removeLayer(lastLayer);
}
console.log("earthquakesData:", earthquakesData);
eqfeed_callback(earthquakesData)
收入水平图代码:1
2
3
4
5
6
7
8
9
10
11
12
13
14
15
16
17
18
19
20
21
22
23
24
25
26
27
28
29
30
31
32
33
34
35
36
37
38
39
40
41
42
43
44
45
46
47
48
49
50
51
52
53
54
55
56
57
58
59
60
61
62
63
64
65
66
67
68
69let incomeLevelTypes = ['OEC', 'NOC', 'UMC', 'MIC', 'LMC', 'LIC', 'HPC'];
let valueArray = [{ "id": "HIC", "value": "高收入(HIC)" },
{ "id": "HPC", "value": "收入严重不足(HIPC)" }, { "id": "INX", "value": "未分类(INX)" },
{ "id": "LIC", "value": "低收入(LIC)" }, { "id": "LMC", "value": "中等偏下(LMC)" },
{ "id": "LMY", "value": "中低等收入" }, { "id": "MIC", "value": "中等收入(MIC)" },
{ "id": "NOC", "value": "高收入:nonOECD(NOC)" }, { "id": "OEC", "value": "高收入: OECD(OEC)" },
{ "id": "UMC", "value": "中等偏上(UMC)" }
];
let getMap = function(valueArray) {
let map = {};
for (let index = 0; index < valueArray.length; ++index) {
let value = valueArray[index];
map[value['id']] = value['value'];
}
return map;
};
let valueMap = getMap(valueArray);
let incomeLevelToText = function(value) {
return valueMap[incomeLevelTypes[value]];
};
let colorFunction1 = new L.HSLLuminosityFunction(new L.Point(0, 0.2), new L.Point(incomeLevelTypes.length - 1, 0.75), { outputHue: 0, outputLuminosity: '100%' });
let fillColorFunction1 = new L.HSLLuminosityFunction(new L.Point(0, 0.5), new L.Point(incomeLevelTypes.length - 1, 1), { outputHue: 0, outputLuminosity: '100%' });
let styles = new L.StylesBuilder(incomeLevelTypes, {
displayName: incomeLevelToText,
color: colorFunction1,
fillColor: fillColorFunction1
});
let options = {
recordsField: '1',
locationMode: L.LocationModes.COUNTRY,
codeField: 'id',
displayOptions: {
'incomeLevel.id': {
displayName: '收入水平',
styles: styles.getStyles()
}
},
layerOptions: {
fillOpacity: 0.7,
opacity: 1,
weight: 1
},
tooltipOptions: {
iconSize: new L.Point(100, 65),
iconAnchor: new L.Point(-5, 65)
},
onEachRecord: function(layer, record) {
let $html = $(L.HTMLUtils.buildTable(record));
layer.bindPopup($html.wrap('<div/>').parent().html(), {
maxWidth: 400,
minWidth: 400
});
}
};
let incomeLayer = new L.ChoroplethDataLayer(incomeLevels, options);
let legendControl = new L.Control.Legend();
legendControl.addTo(map);
map.addLayer(incomeLayer);
5.GeoJSON
假设我们需要自己做个地图,然后加载到平台中。这个时候可以使用我们提供了编辑栏,编辑后会得到坐标,把坐标转成GeoJSON数据存到数据库中,下次加载的时候解析即可。
还可以使用GIS工具,做成GeoJSON的数据,然后使用下面的方法加载,详细说明的传送门在这,当然这包括MapServer的东西,我们将在第六部分有简要说明。
示例图:
引入数据:1
import { json_china } from '../data/china.js';
1 | function pop_0(feature, layer) {//部分有省略 |
6.MapServer
再进一步,如果我们想要自己的地图服务器,这个时候就需要使用到了MapServer,具体的说明见传送门
有个示例在test文件夹下:leaflet-mapserver.html。注意这个是需要配置好服务器的,在这里直接预览是不能成功的。
示例得到我们的世界地图的地图服务器。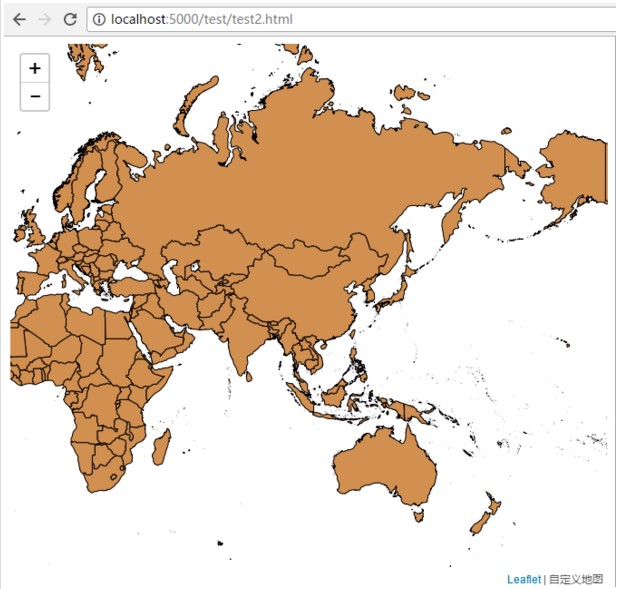
其实leaflet和D3等开源库结合起来,能得到很多丰富多彩的可视化图,姑且留下点神秘,这里就不再探究两者结合的神奇魅力了。